December 16, 2025
Silver Technical Analysis Report: The $64.60 Crucible – 16 December 2025
Exclusive Market Insight for Gold Trade, Dubai
The year 2025 has cemented a powerful narrative for Silver (XAG/USD) , with the white metal outperforming its golden counterpart by a significant margin. As of December 16, 2025, Silver is consolidating near its historical highs, a testament to the potent mix of safe-haven appeal, lower real yields, and unprecedented industrial demand from green energy sectors. This comprehensive technical analysis report, tailored for Gold Trade, Dubai, will dissect the current price action, identify critical levels, and outline the most likely scenarios for silver traders and investors in the immediate term.
The Macro Backdrop: Industrial Revolution Meets Safe Haven
The key to understanding Silver's remarkable rally in 2025—which saw prices surge over 100% year-to-date—lies in its dual identity.
- Industrial Demand Surge: The global acceleration of the Green Energy Transition (solar panels, electric vehicles, 5G technology) has created a structural supply deficit. Silver is a critical, irreplaceable component in photovoltaic cells, meaning demand is becoming increasingly price-inelastic. This is a long-term bullish fundamental not seen in previous cycles.
- Monetary Policy Tailwinds: The US Federal Reserve's dovish pivot and rate cuts have driven real Treasury yields lower. Since silver, like gold, does not pay interest, a lower real yield environment significantly reduces the opportunity cost of holding silver, fueling investment demand from ETFs and retail buyers.
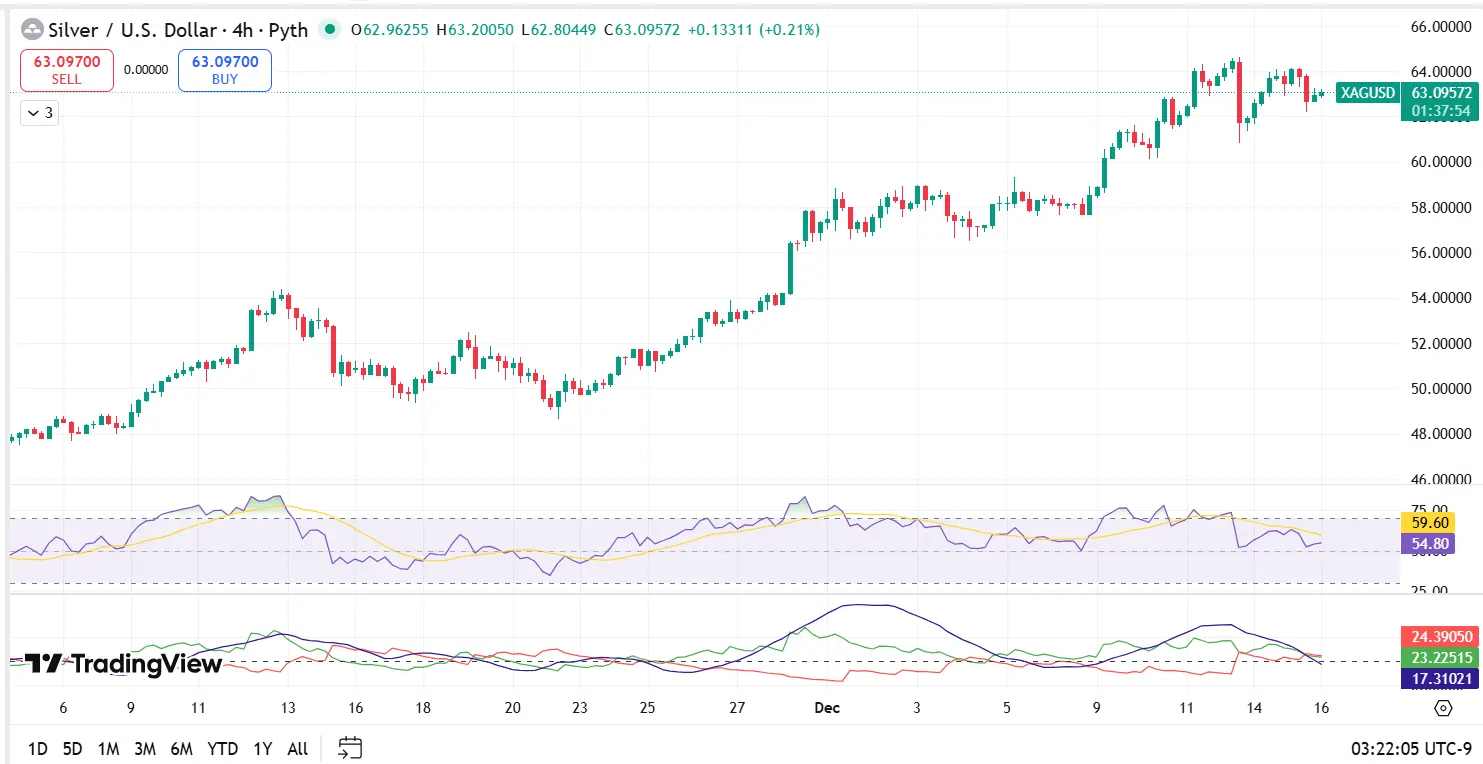
Currently, XAG/USD is attempting to offload overbought conditions following its recent ascent, entering a healthy consolidation phase just shy of the historical resistance at $64.60.
Technical Chart Breakdown: The Path to Price Discovery
Our examination of the daily and 4-hour charts for XAG/USD confirms a powerful, well-defined uptrend. The price action is characterized by a series of higher highs and higher lows, with all major moving averages maintaining a strong bullish alignment.
- Key Support and Resistance Levels (Short-Term Focus)
The market's immediate focus is the structural resistance at $64.60, the previous all-time high. A clear breach of this level will put Silver into price discovery territory, where historical resistance no longer offers guidance.
Level Type Price (USD/oz) Significance Market Impact All-Time High (ATH) / R2 $64.60 - $65.00 Critical historical barrier. A break here signals an exponential move. Breakout target. A confirmed close above this zone targets the next extensions. Immediate Resistance 1 (R1) $63.80 - $64.00 Intraday ceiling, aligned with recent swing high. Intraday hurdle; a break validates the short-term bullish momentum. Pivot Zone (PP) $62.50 - $62.70 Mid-range pivot; the equilibrium point for short-term trade. Holding above maintains the bullish bias; a break below suggests weakness. Major Support 1 (S1) $61.50 - $61.80 Confluence of the 20-period Exponential Moving Average (EMA20) and previous short-term resistance. Primary 'buy-the-dip' zone. Must hold to prevent a deeper correction. Structural Support 2 (S2) $60.00 - $60.50 Strong psychological and horizontal support. The defense line for the medium-term uptrend. A break here signals a major profit-taking phase. - Momentum and Trend Indicators
- Relative Strength Index (RSI - 14 Period): The RSI has recently retreated from levels above 70, falling to the mid-50s. This drop is seen as a healthy unwinding of overbought conditions, not a signal of trend reversal. It effectively "resets" the indicator, providing ample room for the price to ascend further without immediately hitting unsustainable levels.
- Moving Averages: The Silver price is currently trading well above its short-term (EMA20) and medium-term (EMA50) moving averages. The tight and upward-sloping convergence of these averages reflects strong underlying trend confidence.
- Average Directional Index (ADX): The ADX is currently registering an elevated value, often above 40, which strongly confirms that the current bullish trend is highly dominant and non-random.
- The Gold/Silver Ratio (GSR) - A Key Indicator
The Gold/Silver Ratio (GSR) , which measures how many ounces of silver it takes to buy one ounce of gold, has been in a sustained decline, currently hovering around 82. Historically, a low ratio (closer to 40-60) signifies Silver's outperformance. The fact that the GSR is trending down from its recent highs indicates that Silver is structurally gaining strength relative to Gold, a classic signal that the "smart money" is actively accumulating the industrial metal. A move toward the next major support for the GSR at 75 would imply an even more dramatic move higher for XAG/USD.
Technical Scenarios for Silver (XAG/USD)
Based on the intersection of fundamental strength and consolidation in the charts, we highlight two distinct scenarios for Silver trading in the coming sessions:
Primary Bullish Scenario (Breakout and Continuation)
The technical structure strongly favors a continuation of the upward trajectory. This scenario is validated by:
- Successful defense of Major Support 1 ($61.50 - $61.80) during the current pullback.
- A decisive close on the daily chart above the historical resistance at $64.60.
A confirmed breakout above $64.60 will mark a pivotal moment, triggering a rapid short squeeze and momentum buying toward the next calculated technical extension targets: $68.00 and potentially $72.00. This would be Silver entering true price discovery mode.
“Silver’s consolidation near $64.00 is a coiled spring. The industrial demand floor has raised the probability of a high-conviction breakout once the resistance is cleared.”
Alternative Bearish Scenario (Deeper Correction)
A deeper, though temporary, correction cannot be ruled out, especially if the forthcoming US economic data (like the NFP report) surprises the market with unexpected strength, leading to a sudden spike in the US Dollar Index (DXY).
- A convincing break and close below Major Support 1 ($61.50) would signal a wave of profit-taking, likely leading to a test of the strong psychological and structural support zone at $60.00 - $60.50.
- A highly unlikely break below the $60.00 level would significantly threaten the medium-term bullish structure, suggesting a larger, more complex correction toward the $58.00 mark.
For investors in Silver bullion and long-term positions, any pullback toward the $60.00 - $61.50 range should be considered a strategic accumulation opportunity rather than a reason for panic.
Investment Outlook for Gold Trade Clients
Silver is performing exceptionally well, supported by a unique blend of structural industrial scarcity and supportive monetary policy. The technical analysis confirms the underlying trend remains fiercely bullish.
- For Traders: Monitor the $64.60 resistance. A clean break is an entry signal for a momentum trade. The S1 zone at $61.50 is the optimal re-entry point for 'buy-the-dip' strategies.
- For Investors: The long-term forecast for silver remains profoundly optimistic, with several major institutions projecting targets well into the $70 - $100 range over the next 12-24 months, driven by the persistent supply deficit and accelerating industrial use. Silver represents a compelling way to gain leveraged exposure to the broader precious metals bull market and the Green Energy revolution. Dubai gold and silver investment is perfectly positioned to capitalize on this megatrend.
Gold Trade, Dubai encourages clients to maintain a strategic position in XAG/USD, leveraging the strong technical signals and reinforcing fundamentals.
Disclaimer: This Silver Technical Analysis Report is published by Gold Trade, Dubai, for informational purposes only and should not be construed as investment advice. Trading in precious metals carries risk. Consult your financial advisor for personalized investment strategies.
« Back to News & Reports List