December 16, 2025
Gold Technical Analysis Report: Navigating the $4,300 Crossroads - 16 December 2025
Exclusive Report for Gold Trade, Dubai
In a global financial landscape perpetually seeking stability, Gold (XAU/USD) continues to assert its dominance, trading near all-time highs as of December 16, 2025. This exclusive technical analysis report for Gold Trade, Dubai, dives deep into the price action of the yellow metal, identifying key levels and potential trajectories for traders and investors. We aim to provide a comprehensive outlook to help you navigate the gold market in the closing weeks of 2025.
Current Market Context: The Bullish Consolidation
The gold price has shown remarkable resilience, fueled primarily by an evolving macro-economic narrative. The US Federal Reserve's recent rate cuts—the third of the year—and a cautious outlook on future hikes have significantly lowered the opportunity cost of holding the non-yielding asset. Coupled with persistent geopolitical uncertainties and structural safe-haven demand, this has propelled XAU/USD into a phase of bullish consolidation near its historical peak of $4,381.
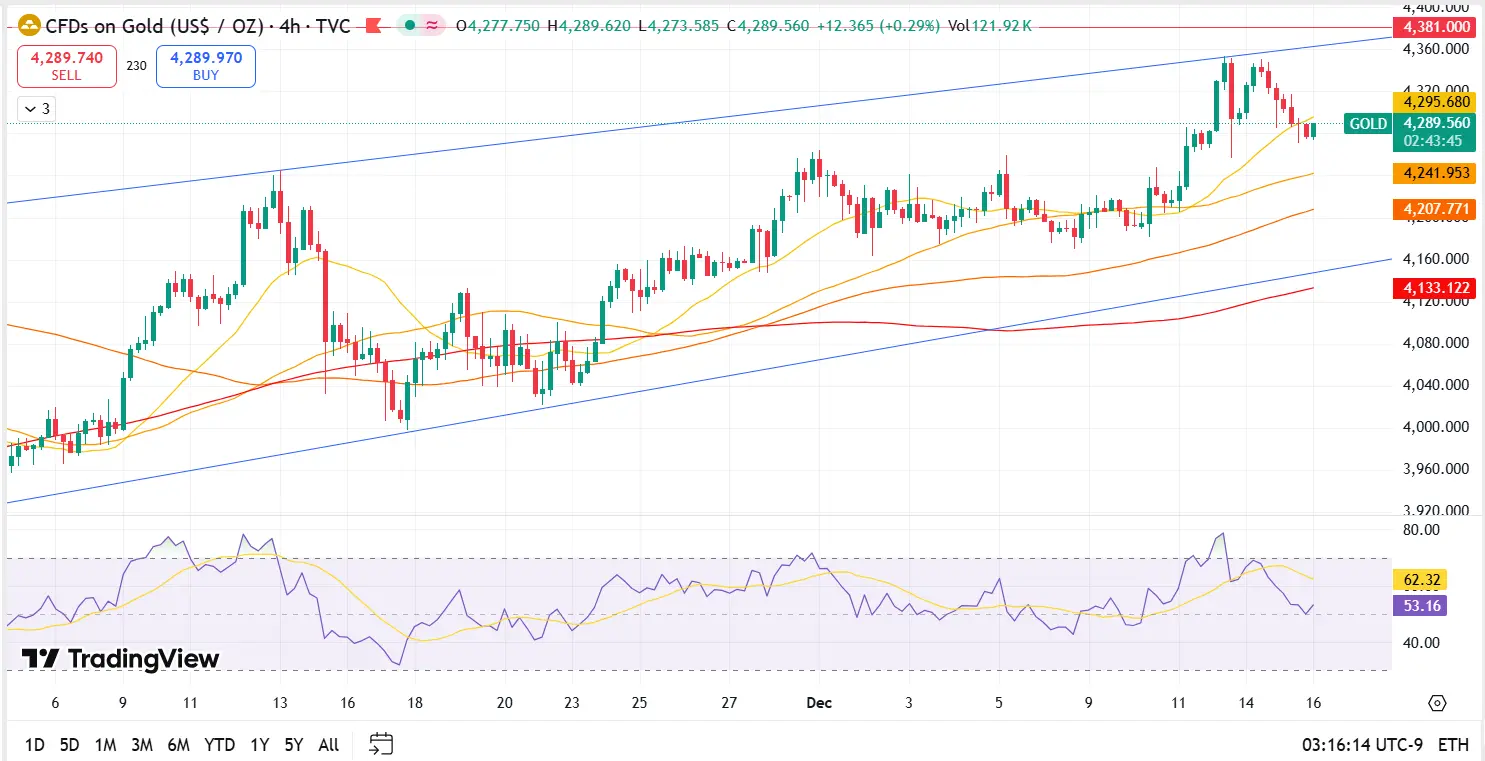
As the market awaits crucial US economic data, including the delayed Nonfarm Payrolls (NFP) report, Gold is in a truce to catch its breath near the psychologically important $4,300 level. This consolidation, visible on the 4-hour and daily charts, suggests accumulation by institutional buyers rather than an immediate distribution, reinforcing the long-term bullish bias.
Technical Deep Dive: Key Levels and Indicators
Our analysis of the XAU/USD chart on the daily and 4-hour timeframes reveals a clear, structural upward trend. The price is trading well above its major moving averages, a hallmark of a healthy uptrend.
- Immediate Support and Resistance (Short-Term View)
Level Type Price (USD/oz) Significance Market Impact Major Resistance 1 (R1) $4,350 - $4,365 Short-term swing high, first hurdle to new highs. A decisive close above this zone would target the All-Time High. All-Time High (ATH) $4,381 Critical psychological and structural barrier. A breakout here would signal a high-conviction move toward $4,400 and beyond. Pivot Point (PP) $4,310 - $4,300 Key psychological and technical pivot for today's trade. Holding above this keeps the intraday bias bullish; a break below suggests profit-taking. Major Support 1 (S1) $4,285 - $4,265 Confluence of previous resistance-turned-support and 50-period Exponential Moving Average (EMA50) on the 4-hour chart. The primary 'buy-the-dip' zone. Must hold to maintain short-term bullish control. Major Support 2 (S2) $4,245 - $4,250 Strong horizontal support, aligning with a prior breakout level. A break below S1 is likely to test this stronger structural support. - Momentum Indicators
- Relative Strength Index (RSI - 14 Period): The RSI is currently hovering just above the 50 mark, indicating that while bullish momentum is present, the market is not in severely overbought territory. This provides room for gold to rise before exhaustion sets in, making the current pullback a healthy consolidation.
- Moving Averages: The gold price is trading significantly above both the 50-day and 100-day Simple Moving Averages (SMAs), confirming the dominant medium-to-long-term bullish trend. The EMA50 on the 4-hour chart around $4,285 is acting as a dynamic support level.
- Elliott Wave Analysis (Long-Term)
Preliminary Elliott Wave Theory suggests that XAU/USD is potentially developing within an ascending wave of a larger degree, with a long-term target range extending toward $4,600 - $4,800. This analysis reinforces the view that the underlying structure is profoundly bullish and that current dips should be viewed as buying opportunities in the context of this multi-year trend. Note: Elliott Wave analysis is highly subjective and should be used as a guiding framework, not a definitive forecast.
Technical Scenarios for December 16, 2025
Based on the current price structure and momentum, we project two primary scenarios for Gold today:
Primary Bullish Scenario (Continuation)
The most probable scenario remains an upward continuation. This would be triggered by:
- Sustained price action above the Pivot Point ($4,300) and Major Support 1 ($4,265) .
- A clean breakout and 4-hour candle close above the immediate Resistance 1 zone ($4,350) .
Should this unfold, the market will quickly test the All-Time High at $4,381. A successful, high-volume break of this level is expected to pave the way for a sharp impulse move toward the next major psychological level at $4,400, with an extended target at $4,470.
“The key for bulls is to defend the $4,265–$4,285 zone. As long as Gold holds above this prior consolidation area, the path of least resistance remains to the upside.”
Alternative Bearish Scenario (Correction/Profit-Taking)
A temporary correction could be activated by aggressive profit-taking, likely exacerbated by a surprisingly hawkish outcome from this week's US data, such as a strong NFP report.
- A decisive break and close below Major Support 1 ($4,265) . This would trigger a move toward the stronger, deeper support at $4,200 - $4,245.
- A break below the $4,200 mark would raise greater concern, signaling a potential shift in short-term market dynamics and bringing the long-term trend line support near $4,170 into play.
It is crucial to note that even in a bearish correction, the overall structural trend remains bullish. Investors should view substantial pullbacks toward the $4,200 level as strategic gold buying opportunities.
Investment Strategy Takeaways
This technical analysis report confirms that Gold remains in a strong, structural uptrend, making it a compelling asset for portfolio diversification and as a monetary hedge.
- For Short-Term Traders: Focus on confirming a break above $4,350 for continuation trades or looking for entries near the $4,265 support for 'buy-the-dip' strategies. Use the $4,245 level as a critical stop-loss reference point.
- For Long-Term Investors: The macro environment—characterized by lower interest rates and persistent global uncertainty—continues to favor gold. A systematic accumulation strategy, focusing on scaling in during pullbacks, remains the most prudent approach. Dubai gold investment is supported by a stable market and high liquidity.
Gold Trade, Dubai advises all clients to monitor the forthcoming US economic data closely, as high-impact reports can inject significant volatility into the XAU/USD price chart.
Disclaimer: This Gold Technical Analysis Report is for informational purposes only and does not constitute financial advice. Trading XAU/USD involves significant risk, and it is recommended to consult with a professional financial advisor before making any investment decisions. Gold Trade, Dubai is not liable for any losses incurred based on this report.
« Back to News & Reports List