December 18, 2025
Silver’s Historic Breakthrough: Technical Analysis Report – 18 Dec 2025
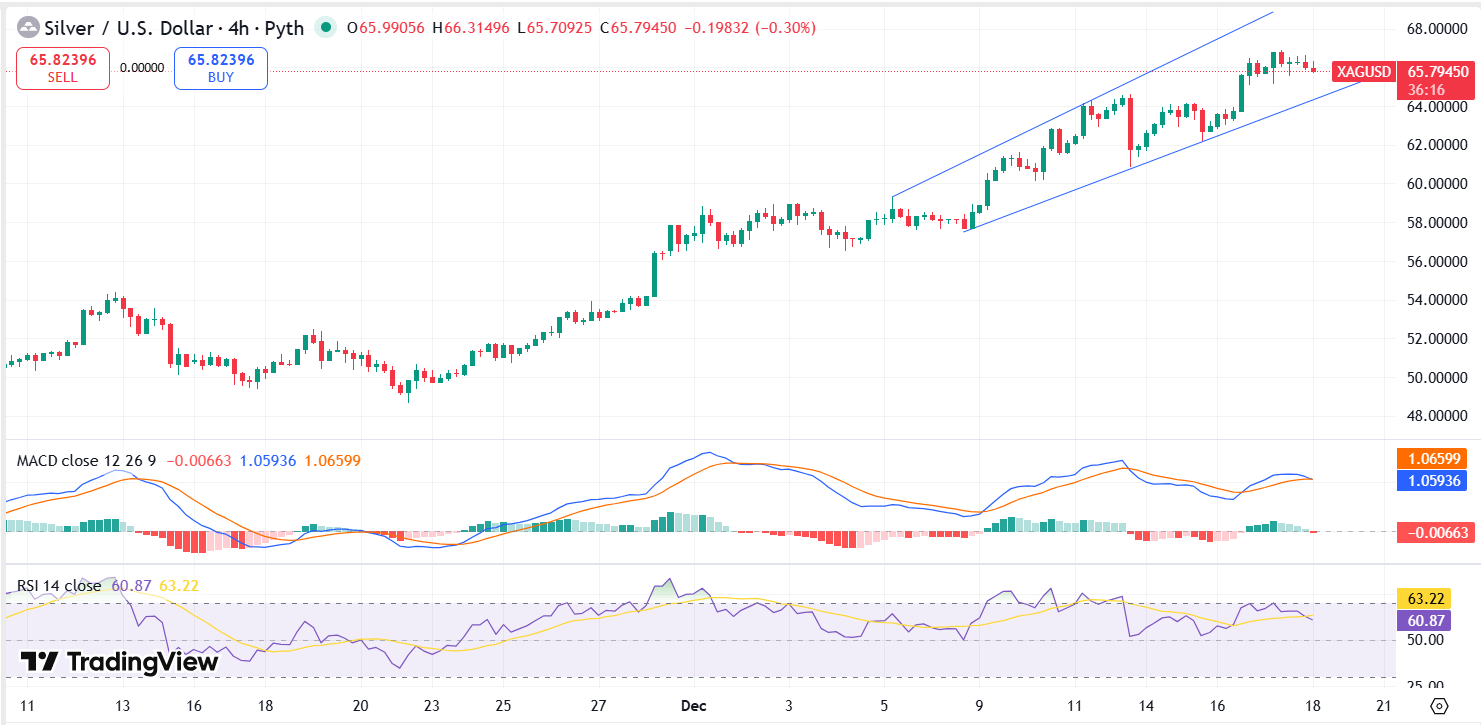
As the final weeks of 2025 unfold, the global commodities market is witnessing a "silver surge" that has surpassed even the most aggressive institutional forecasts. While gold continues its steady climb toward new peaks, silver (XAG/USD) has effectively broken its shackles, trading today at a staggering $66.15 per ounce.
For investors and traders at Gold Trade, Dubai, this isn’t just a price rally; it is a structural "repricing" of the white metal. In this comprehensive technical analysis for December 18, 2025, we dissect the momentum indicators, structural patterns, and the unique Dubai-market variables that are driving silver toward the psychological $70 frontier.
Market Pulse: Silver at $66.15
Silver’s performance in 2025 has been nothing short of legendary. Starting the year in the low $30s, the metal has gained over 115% year-to-date, significantly outperforming gold's 65% rise. As of this morning, the spot price is consolidating around $66.15, successfully holding above the previous resistance-turned-support level of $65.00.
In the Dubai retail market, the impact is palpable. With the UAE Dirham pegged to the US Dollar, the local silver rate has surged to approximately AED 8,800 per kilogram for 999 Fine Silver. This move has triggered a wave of "silver-stacking" across the Emirates, as retail investors look for higher-beta alternatives to gold.
Technical Deep Dive: The $65 Breakout and Beyond
The most significant technical development in the latter half of 2025 has been the completion and successful breakout of a multi-year Cup and Handle pattern on the weekly and monthly charts.
1. Structural Breakout & Fibonacci Targets
After a decade of trading in a wide horizontal channel, silver's breach of the $50 mark in late Q3 2025 validated the "Cup" base. Today's price of $66.15 places silver in "price discovery" mode. Using Fibonacci extension tools from the 2024 lows to the late 2025 highs, we find the following key levels:
| Technical Level | Price (USD/oz) | Market Significance |
|---|---|---|
| Major Resistance 2 | $74.50 | 2.618 Fibonacci extension; the next big target for 2026. |
| Psychological Barrier | $70.00 | Expected zone for short-term profit-taking. |
| Immediate Support 1 | $65.00 | Critical breakout retest level; must hold for bullish continuation. |
| Dynamic Support | $59.20 | Aligned with the 50-day Simple Moving Average (SMA). |
| Long-term Floor | $48.50 | The 200-day Exponential Moving Average (EMA). |
2. Moving Averages: The Slope of Success
The "Golden Cross" (the 50-day EMA crossing above the 200-day EMA) occurred in early 2025 and has acted as a persistent launchpad. Currently, the gap between the price and the 200-day EMA ($48.50) is historically wide. While this indicates extreme bullish strength, it also warns of a "mean reversion" risk. However, as long as the 50-day SMA ($59.20) remains sloped upward, the trend remains unequivocally long.
Momentum Indicators: Overbought or Just Getting Started?
Relative Strength Index (RSI)
On the daily chart, the 14-day RSI is currently hovering at 71.2. Conventionally, a reading above 70 suggests an "overbought" condition. However, in "blow-off top" phases of a commodity bull market, the RSI can remain in the 70–85 range for extended periods. At Gold Trade, Dubai, we advise looking for "bearish divergence" (price making higher highs while RSI makes lower highs) as a signal for a top—currently, this signal is absent.
MACD (Moving Average Convergence Divergence)
The MACD histogram is expanding in the positive zone. The signal line is trending steeply upward, indicating that the buyers are in full control of the narrative. There is no sign of a "death cross" in the near term, suggesting that any intraday dips toward $64.00 are likely to be aggressively "bought up."
The Gold-to-Silver Ratio: The Convergence Play
Perhaps the most compelling argument for silver’s continued rise is the Gold-to-Silver Ratio. For much of the last few years, the ratio hovered near 85:1, meaning it took 85 ounces of silver to buy one ounce of gold.
With gold currently trading at approximately $4,330 and silver at $66.15, the ratio has compressed to 65.4:1.
Strategic Outlook: In historic bull markets, this ratio has dropped as low as 30:1 or 40:1. If the ratio continues to mean-revert toward 50:1 while gold stays flat, silver would be priced at $86.60. This "undervaluation" compared to gold is what is driving institutional rotation from gold into silver bullion.
Macro-Economic & Industrial Catalysts
Silver’s technical strength is supported by a "perfect storm" of fundamental factors:
- The Industrial Super-Cycle: Silver is the most conductive element on Earth. In 2025, the demand from Solar Photovoltaics (PV) has hit record highs as China and the EU push for 100% renewable energy grids.
- The EV and AI Boom: Electric vehicles use twice as much silver as traditional cars. Furthermore, the massive expansion of AI Data Centers in 2025 has created a new, non-traditional source of demand for silver-based electrical components.
- The Supply Deficit: 2025 marks the fifth consecutive year of a global silver supply deficit. Mine production in Mexico and Peru has plateaued, and recycling cannot keep pace with the "green energy" thirst.
Dubai Market Snapshot: AED Pricing for 18 Dec 2025
For our clients at Gold Trade, Dubai, the local market remains highly liquid. Due to the high spot price, we are seeing a shift in preference from large bars to smaller, more divisible units.
- Silver Spot (AED/oz): AED 242.94
- 24K Gold vs Silver: While gold remains the ultimate safe haven, silver is being viewed as the "growth engine" of the precious metals portfolio.
- Investment Insight: Physical premiums in Dubai remain some of the lowest globally, but with spot at $66.15, the "making charges" for silver coins have seen a slight increase due to logistics and refining costs.
Strategy for the Session: How to Trade $66.15
For Long-Term Investors
Maintain your "Hold" position. The structural deficit and the Gold-to-Silver ratio suggest that the $70–$75 range is the next logical stop before the end of Q1 2026. Avoid the temptation to liquidate early unless the price breaks below the $59.00 support on a weekly closing basis.
For Short-Term Traders
Look for intraday pullbacks to the $65.10–$65.50 zone. Set a tight stop-loss at $63.80. The target for this scalp should be the $68.50 level.
Conclusion: The Era of "Industrial Gold"
Silver’s rise to $66.15 on December 18, 2025, is a testament to its dual identity as both a monetary hedge and an indispensable industrial asset. The technical charts are "screaming" bullish, and the fundamental supply-demand gap is widening daily.
As we look toward 2026, silver is no longer just following gold—it is leading the charge. At Gold Trade, Dubai, we remain your dedicated partner in navigating these historic markets, providing the tools and transparency you need to capitalize on the silver super-cycle.
Disclaimer: This Silver Technical Analysis Report is for informational purposes only and does not constitute financial advice. Trading XAU/USD involves significant risk, and it is recommended to consult with a professional financial advisor before making any investment decisions. Gold Trade, Dubai is not liable for any losses incurred based on this report.
« Back to News & Reports List