December 19, 2025
Gold Technical Analysis Report: 18 December 2025 – Navigating the Historic $4,300 Breakout
As the year 2025 draws to a close, the global gold market is witnessing a historic epoch. For investors at Gold Trade, Dubai, today’s session on December 18, 2025, represents a critical crossroads. After a year defined by unprecedented central bank accumulation and a structural shift in global monetary trust, the "yellow metal" is currently coiling within a high-stakes technical formation.
In this comprehensive report, we break down the technical levels, macroeconomic catalysts, and local Dubai market trends that are shaping the gold price forecast as we head into 2026.
Executive Summary: The "City of Gold" Perspective
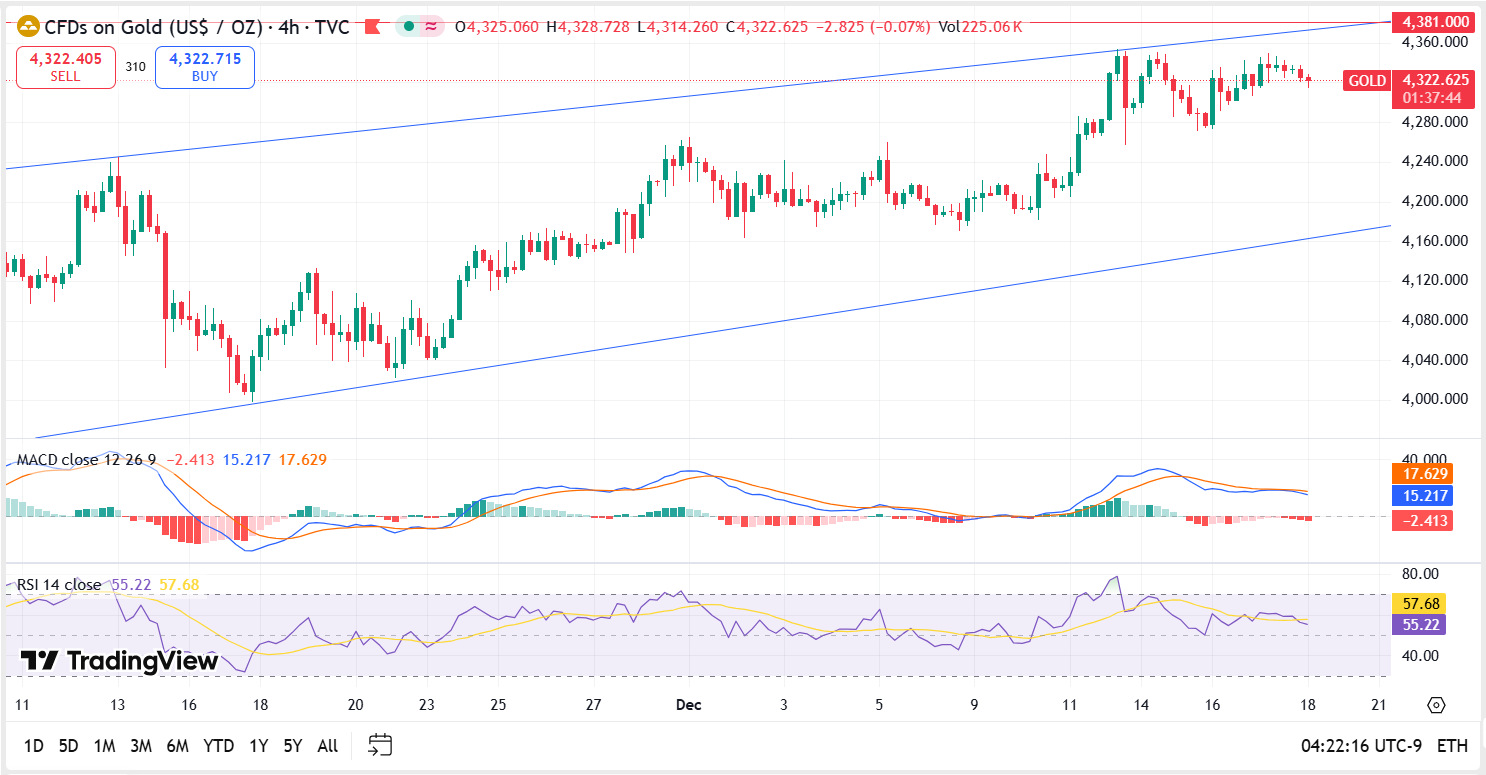
The spot price of gold (XAU/USD) is currently hovering around the $4,330 mark, showing remarkable resilience despite a slight correction from the late October all-time high of $4,381. In the Dubai retail market, 24K gold is trading near AED 523.25 per gram, reflecting a year-to-date gain of nearly 65%.
The primary narrative for today involves a "wait-and-see" approach from institutional traders as they digest recent US Consumer Price Index (CPI) data and the Federal Reserve’s latest signals regarding 2026 interest rate cuts.
Technical Analysis: The Symmetrical Triangle & Key Levels
From a technical standpoint, gold is currently exhibiting a Symmetrical Triangle pattern on the 4-hour and daily charts. This pattern typically indicates a period of consolidation before a massive breakout. The price is currently compressed between a rising support trendline and a descending resistance line.
Support and Resistance Matrix
For traders at Gold Trade, Dubai, monitoring these intraday and weekly levels is essential for risk management:
| Level Type | Price (USD/oz) | Significance |
|---|---|---|
| Major Resistance 2 | $4,400 | Psychological ceiling and multi-year target. |
| Immediate Resistance 1 | $4,350 | Recent swing high; a break above confirms a bullish exit from the triangle. |
| Pivot Point | $4,310 | The 21-period Simple Moving Average (SMA) acts as today's gravity center. |
| Key Support 1 | $4,260 | Reinforced by the 50-day Exponential Moving Average (EMA). |
| Critical Floor | $4,200 | Strong structural support from the early December breakout zone. |
The Indicator Suite: Momentum and Trends
1. Relative Strength Index (RSI)
The 14-day RSI is currently reading 57.77. This is the "Goldilocks" zone for bulls—it indicates that while the trend is positive, the market is not yet "overbought" (which typically occurs above 70). This suggests there is still significant "dry powder" or room for the price to climb before a major exhaustion reversal occurs.
2. Moving Averages (The Golden Cross)
The market remains firmly in a long-term bullish phase. The 50-day EMA ($4,230) is trending significantly above the 200-day EMA, maintaining the "Golden Cross" formation that has powered the 2025 rally. As long as the price stays above the 50-day EMA, the "buy the dip" strategy remains the dominant play for Dubai investors.
3. MACD (Moving Average Convergence Divergence)
The MACD histogram is showing slight bullish divergence. Although the signal lines are close, the recent crossover suggests that the short-term momentum is shifting back in favor of buyers after the mid-December cooling period.
Macroeconomic Catalysts: Why Gold is Holding High
The technical setup cannot be viewed in isolation from the fundamental landscape. Several factors are providing a "floor" for gold prices in late 2025:
- US Inflation (CPI) Jitters: With headline inflation lingering around 3.3%, the market is questioning whether the Federal Reserve will continue its rate-cutting cycle in Q1 2026. Higher inflation usually benefits gold as a hedge, but it can also strengthen the US Dollar, creating a tug-of-war.
- Central Bank Accumulation: Data from the World Gold Council shows that BRICS+ nations (including the UAE) have continued their aggressive gold purchasing programs, adding over 300 tonnes in Q3 2025 alone.
- Geopolitical Safe-Haven Demand: Ongoing trade disputes and regional tensions continue to drive institutional capital into "hard assets."
"The current coiling behavior in gold suggests that the market is building pressure. Once the $4,350 resistance is decisively broken, we could see a rapid move toward the $4,500 level before the end of January." — Senior Analyst, Gold Trade Dubai.
Dubai Gold Rate Update – 18 Dec 2025
For our local clients in the UAE, the physical market remains vibrant. Despite the global volatility, the Dubai Gold & Jewellery Group (DGJG) rates have stabilized.
- 24K Gold: AED 523.25
- 22K Gold: AED 484.75
- 21K Gold: AED 464.75
- 18K Gold: AED 398.25
Dubai continues to offer some of the most competitive premiums globally, making it the preferred destination for both bullion investors and retail shoppers during the festive season.
Strategic Outlook: How to Trade Today’s Market
For Conservative Investors
Wait for a daily close above $4,350. A breakout confirmed by high volume would signal the start of the next major leg up. Alternatively, look for entries near the $4,260 support level with a stop-loss placed just below $4,200.
For Aggressive Day Traders
The current range between $4,310 and $4,340 offers scalping opportunities. Use the RSI on the 15-minute chart to identify overextended moves at the triangle boundaries.
Risk Warning
The upcoming Personal Consumption Expenditures (PCE) report and the Bank of Japan's policy decision are "wildcard" events. Increased volatility is expected. We recommend maintaining a disciplined stop-loss strategy to protect capital against sudden USD spikes.
Conclusion: A Golden Era Continues
The Gold Technical Analysis for December 18, 2025, confirms that the primary trend is Bullish. While short-term consolidation is healthy after such a meteoric rise this year, the structural foundations of the market suggest that the "path of least resistance" remains upward.
As Dubai’s leading authority in precious metals, Gold Trade remains committed to providing you with real-time insights and the most competitive trading conditions in the Middle East.
Disclaimer: This Gold Technical Analysis Report is for informational purposes only and does not constitute financial advice. Trading XAU/USD involves significant risk, and it is recommended to consult with a professional financial advisor before making any investment decisions. Gold Trade, Dubai is not liable for any losses incurred based on this report.
« Back to News & Reports List