December 23, 2025
Silver Technical Analysis Report: Dec 23, 2025 | XAG/USD Eyes $70 as Historic Rally Accelerates
Dubai, UAE — In a year defined by the relentless ascent of precious metals, silver has officially moved out of gold's shadow to become the premier performer of 2025. On this Tuesday, December 23, 2025, the global markets are witnessing a watershed moment as Silver (XAG/USD) hovers just cents away from the psychological $70.00 per ounce milestone.
For the clients of Gold Trade, 2025 has been a transformative year. While gold has reached staggering highs above $4,500, silver has outperformed its "big brother" on a percentage basis, posting a year-to-date gain of over 130%. This report provides a comprehensive technical and fundamental breakdown of the silver market as we enter the final trading week of a historic year.
Technical Analysis: Breaking Barriers at $69.50
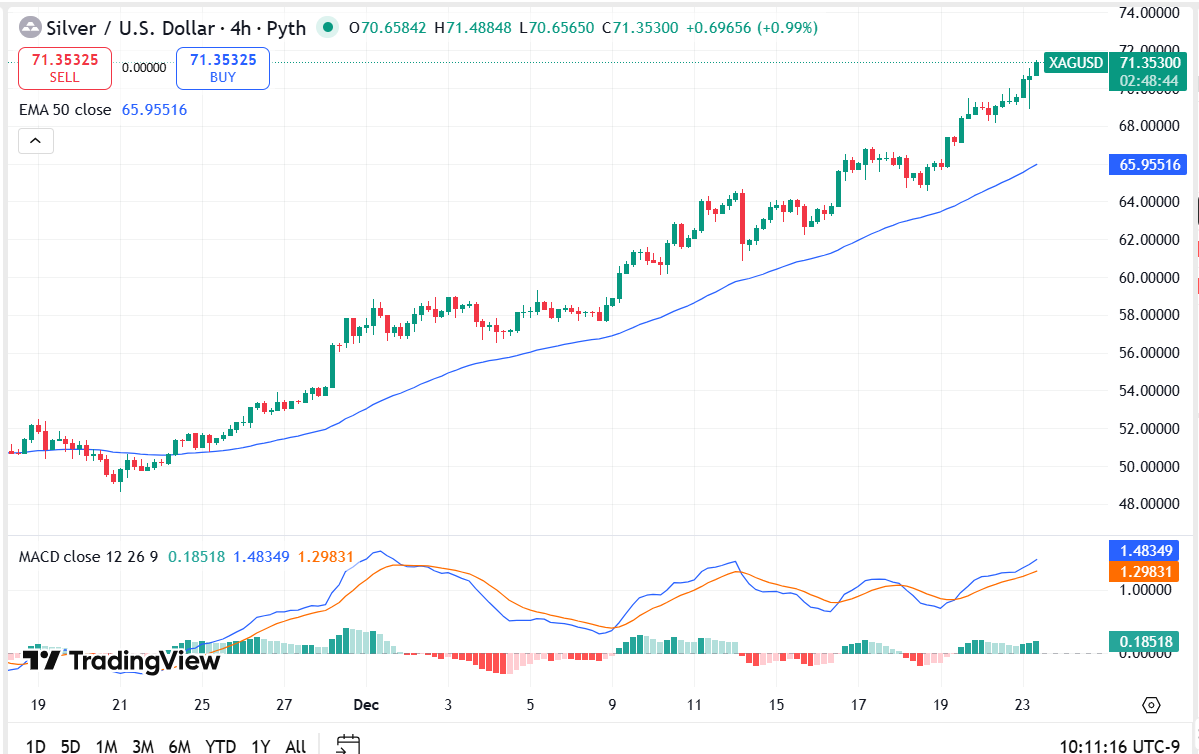
The price action today, December 23, 2025, confirms that the bullish momentum is not only intact but accelerating. Following a sharp rally on December 22 that pushed the metal past the previous record high of $67.50, silver is currently consolidating in a tight range between $68.90 and $69.60.
1. Trend Structure and Chart Patterns
The dominant technical feature on the daily chart is a massive Cup and Handle breakout that triggered in mid-October. This pattern, which took nearly six months to form, has a technical target that aligns perfectly with the $72.00 – $75.00 zone.
- Support Turnaround: The previous resistance at $67.00 has now transitioned into a "hard floor" support level. Any minor retracement toward this zone is being met with aggressive institutional buying.
- Moving Average Alignment: XAG/USD is trading well above its 50-day Exponential Moving Average (EMA) , currently situated at $67.26, and its 200-day EMA at $50.93. The slope of these averages remains steeply positive, a textbook indicator of a healthy, structural bull market.
2. Key Momentum Indicators
Despite the rapid price increase, technical oscillators suggest that the market is not yet "dangerously" overstretched.
| Indicator | Current Value (Dec 23, 2025) | Market Signal |
|---|---|---|
| RSI (14) | 61.75 | Bullish – Room to grow before reaching extreme 70+ overbought levels. |
| MACD (12, 26) | 0.436 (Positive) | Strong Buy – The histogram is expanding, indicating rising momentum. |
| ADX (14) | 25.27 | Trending – Suggests the trend is gaining strength after a consolidation phase. |
| Fibonacci Pivot | $68.78 | Bullish – Price is currently trading above the primary daily pivot point. |
Technical Insight: The current Relative Strength Index (RSI) of 61.75 is particularly encouraging for bulls. It suggests that unlike the "frothy" rallies seen in previous years, the current move is backed by steady accumulation rather than pure speculative mania.
Fundamental Drivers: The Dual-Engine Rally
Silver’s unique position as both a monetary safe-haven and an indispensable industrial metal has created a "supply-demand squeeze" that is rarely seen in commodity markets.
1. The Industrial Revolution: AI, Solar, and EVs
The primary catalyst for silver’s outperformance in 2025 is the explosion in industrial demand.
- AI Data Centers: The rapid expansion of Artificial Intelligence infrastructure has led to a 5,000% increase in IT power demand over the last two decades. Silver’s superior conductivity makes it vital for the advanced semiconductors and cooling systems used in global data centers.
- Photovoltaics (Solar): Solar energy now accounts for approximately 29% of global silver demand. As the EU and China race to meet their 2030 green energy mandates, the silver "loading" in solar panels has become a critical supply bottleneck.
- Electric Vehicles (EVs): The shift to electrification means that EVs now consume nearly 80% more silver than traditional internal combustion engines.
2. Macroeconomic & Geopolitical Tailwinds
The broader economic climate continues to favor hard assets.
- The "Fed Pivot": Markets are currently pricing in a pause from the U.S. Federal Reserve after multiple rate cuts in 2025. This has weakened the U.S. Dollar (DXY) and lowered real yields, making non-yielding assets like silver highly attractive.
- Geopolitical Risk: Renewed hostilities in the Middle East and ongoing tensions regarding U.S. trade policies have kept safe-haven demand elevated. For investors in Dubai, silver has emerged as a high-beta alternative to gold for protecting wealth against currency debasement.
The Dubai Perspective: Local Silver Trends
In the "City of Gold," silver is rapidly gaining traction as a primary investment vehicle. At Gold Trade, Dubai, we have noted a significant uptick in physical silver purchases, particularly in the 1kg bar and 100oz bar categories.
Today’s Silver Rates in Dubai (Dec 23, 2025)
Local retail prices reflect the global spot surge and remain highly competitive due to Dubai's efficient trading infrastructure.
- Silver 999 (Per Gram): ~AED 9.52
- Silver 999 (Per Tola): ~AED 111.09
- Silver 1kg Bar: ~AED 9,524.57
- Silver 1oz Coin: ~AED 296.25
The Gold-Silver Ratio (GSR)
One of the most compelling arguments for silver is the Gold-Silver Ratio, which has dropped to 64:1 this December. While this is down from the 80:1 seen earlier in the year, it remains well above the historical average of 15:1 or the modern average of 50:1. This suggests that silver is still "undervalued" relative to gold at $4,500.
Critical Levels to Watch for the Week
To assist our traders and investors at Gold Trade, we have mapped out the following technical "zones of interest":
Resistance (Upside Targets)
- $70.05 (Immediate): The current intraday high. A daily close above this level likely triggers a "short squeeze" toward $72.
- $71.90 (Fibonacci Extension): The secondary target for the current breakout cycle.
- $75.00 (Long-term Ceiling): Our projected target for Q1 2026.
Support (Buying Opportunities)
- $68.20 (Minor Support): The first line of defense for bulls.
- $67.00 (Critical Floor): The primary breakout point and a high-liquidity zone for long-term accumulation.
- $65.80 (Invalidation Level): A break below this would suggest a temporary trend reversal and a deeper correction toward the 50-day EMA.
2026 Outlook: Is the "Silver Squeeze" Just Beginning?
As we look toward 2026, the silver market is projected to enter its seventh consecutive year of a structural supply deficit. With mine production struggling to keep pace with the "Green Revolution" and institutional investors increasingly treating silver as "Digital Age Gold," the fundamentals have never been stronger.
Gold Trade analysts maintain a Strong Buy rating on any meaningful pullbacks. We believe the current consolidation near $69.50 is the "launchpad" for a move toward $80.00 by mid-2026.
Summary for Investors
- Current Trend: Aggressively Bullish.
- Top Trade Idea: Accumulate on dips toward the $67.00 - $68.00 range.
- Portfolio Allocation: We recommend a 15-20% silver allocation within a precious metals portfolio to capitalize on the higher volatility and industrial growth.
Disclaimer: This Silver Technical Analysis Report is for informational purposes only and does not constitute financial advice. Trading XAU/USD involves significant risk, and it is recommended to consult with a professional financial advisor before making any investment decisions. Gold Trade, Dubai is not liable for any losses incurred based on this report.
« Back to News & Reports List