December 24, 2025
Gold Technical Analysis Report – 24 Dec 2025: XAUUSD Shatters Records as Christmas Eve Rally Ignites
As the sun sets over the Dubai skyline this Christmas Eve, the global bullion market is reflecting a glow far brighter than the festive lights of the Burj Khalifa. Gold has officially entered a historic "Santa Claus Rally," with spot prices (XAU/USD) shattering previous glass ceilings to hit an all-time high of $4,525.88 during the early European session.
For investors at Gold Trade, the 2025 calendar year has been nothing short of extraordinary. With a yearly gain exceeding 70%—the best performance since 1979—gold has reclaimed its throne as the ultimate hedge against a fragmented global economy.
In this special technical report, we break down the charts, the psychological triggers, and the local Dubai market dynamics that are shaping the final trading hours of 2025.
1. Market Snapshot: Gold at a Glance
Before diving into the oscillators and moving averages, let’s look at the "at-a-glance" metrics for today, Wednesday, December 24, 2025.
| Metric | Value (USD / Gold Ounce) |
|---|---|
| Current Spot Price | $4,495.00 |
| All-Time High (Today) | $4,525.88 |
| Immediate Support | $4,460.00 |
| Immediate Resistance | $4,525.00 |
| 2025 Year-to-Date Change | +72.4% |
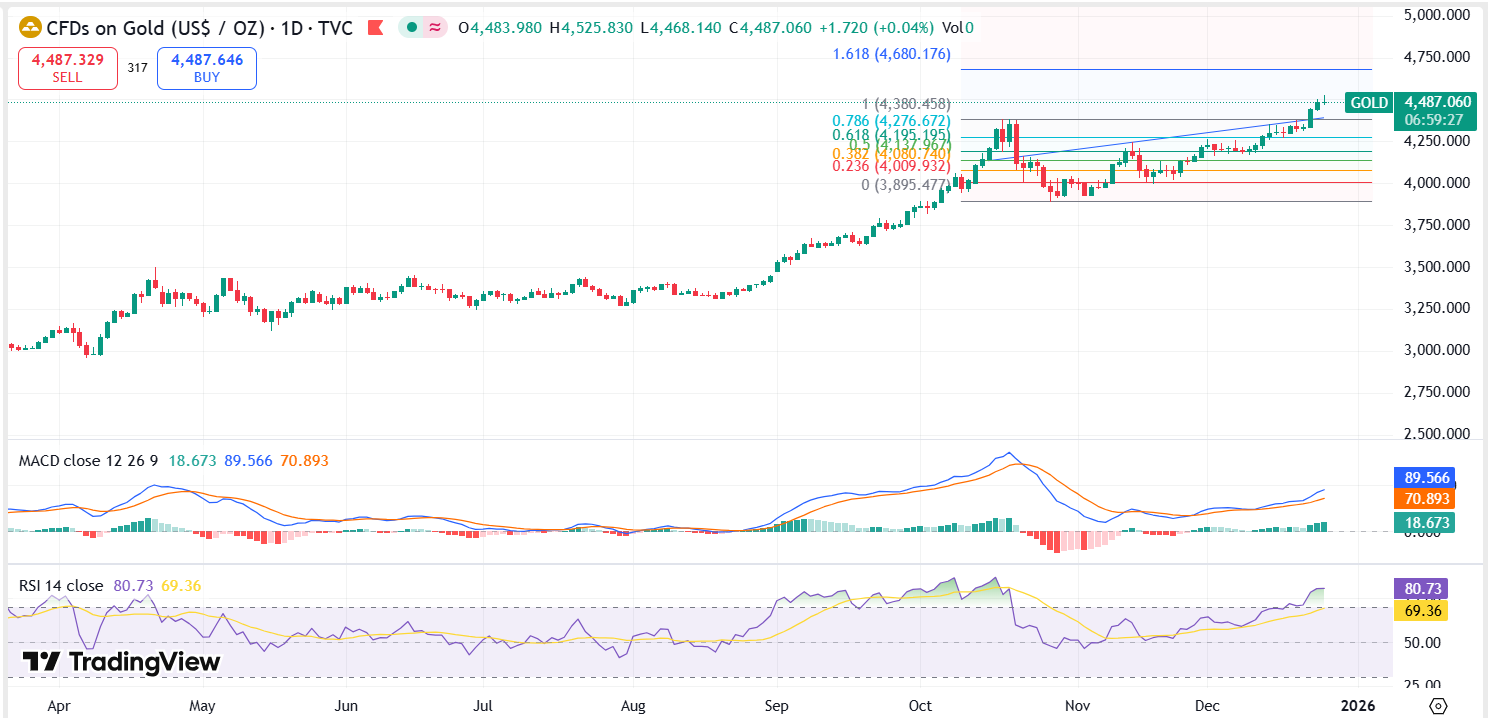
2. Technical Analysis: The Bullish Momentum Continues
The technical structure of Gold in late 2025 is a masterclass in "trend persistence." Despite numerous analyst predictions of a cooling-off period in Q4, the metal has maintained a rigid Ascending Channel on the daily (D1) and weekly (W1) timeframes.
Moving Averages (MA) Analysis
The price action remains significantly above the 100-day Exponential Moving Average (EMA) , currently hovering near $4,280. This wide gap indicates a powerful, momentum-driven trend.
- The 50-Day SMA: Positioned at $4,180, this serves as the "Line in the Sand" for long-term bulls. As long as XAUUSD trades above this level, the structural integrity of the bull market remains undisputed.
- Golden Crossovers: We observed a series of bullish crossovers on the 4-hour (H4) chart earlier this week, which acted as the catalyst for the Christmas Eve breakout.
Relative Strength Index (RSI): Overbought or Just Strong?
The 14-day RSI is currently reading 80.70. In traditional technical theory, anything above 70 is considered "overbought." However, in a parabolic year like 2025, the RSI has frequently stayed above 70 for weeks at a time during strong impulsive waves.
Trader’s Note: While a minor "digestion" or consolidation phase is expected as holiday liquidity thins, the RSI's position suggests that the "path of least resistance" remains upward. A dip toward $4,460 would likely be viewed as a "Buy the Dip" opportunity by institutional desks.
3. Fundamental Drivers: Why $4,500?
Technical levels do not exist in a vacuum. The surge to $4,500 is the culmination of three specific macroeconomic "Perfect Storm" factors that defined the latter half of 2025.
A. The Dovish Fed Pivot
Throughout 2025, the U.S. Federal Reserve transitioned from a "higher for longer" stance to an aggressive rate-cutting cycle. With the Fed funds rate now sitting between 3.50% and 3.75%, real yields have plummeted. Because gold is a non-yielding asset, the lower opportunity cost has funneled billions from the bond market into bullion ETFs.
B. Geopolitical Risk & The "Energy Blockade"
The recent U.S. oil blockade against Venezuela and ongoing maritime tensions in the Mediterranean have reignited fears of supply chain disruptions. Gold Trade clients have increasingly requested physical allocations as a safeguard against "tail-risk" events. When the "shadow fleet" of global trade is under pressure, investors flee to the only asset with no counterparty risk: Physical Gold.
C. Central Bank Accumulation
Central banks, particularly in the BRICS+ nations and emerging markets like Turkey and India, have added over 1,100 tonnes to their reserves this year. This "institutional floor" ensures that even when retail profit-taking occurs, the price remains supported by official-sector buying.
4. The Dubai Perspective: Reshaping the "City of Gold"
In Dubai, the impact of $4,500 gold is visible at the retail level. According to Gold Trade market insights, we are seeing a fascinating shift in consumer behavior:
- The "Lighter Design" Trend: With 24K gold reaching AED 542.00 per gram, jewellery manufacturers are pivoting to 18K and 21K hollow-gold designs to maintain affordability for the wedding season.
- Exchange over Purchase: Roughly 60% of retail transactions in the Dubai Gold Souq now involve "Gold Exchange" programs, where customers trade in old ornaments for new designs rather than paying cash.
- Digital Gold Growth: Dubai-based investors are moving toward Sharia-compliant digital gold platforms, allowing for fractional ownership as the "entry price" for a full ounce becomes prohibitive for smaller savers.
5. Forecast for 2026: Is $5,000 Next?
As we look toward the 2026 horizon, the consensus among major institutions like Goldman Sachs and J.P. Morgan is leaning toward a base case of $4,900 to $5,300.
Key Levels to Watch in Q1 2026:
- Target 1: $4,580. This is the 1.618 Fibonacci extension of the October-November rally.
- Target 2: $4,750. A psychological level where we expect significant institutional "sell orders" to be clustered.
- The Bear Case: If a major geopolitical de-escalation occurs, gold could see a corrective pullback to $3,950. However, given the current "de-dollarization" trend, such a dip would likely be short-lived.
6. Conclusion: A Golden Finale to 2025
The Gold Technical Analysis Report for 24 Dec 2025 confirms one undeniable truth: the "New Era of High Gold" is here. With a closing price near $4,525, the metal has transitioned from a defensive asset to an aggressive performance leader.
For the sophisticated investor, the strategy for the remaining week of 2025 is watchful patience. With holiday volumes thinning, price swings can be exaggerated. Maintain your stop-losses near the $4,338 support zone and look for consolidation signs before entering fresh long positions for the 2026 cycle.
Optimize Your Portfolio with Gold Trade, Dubai
Are you looking to secure your wealth against the volatility of 2026? Whether you are interested in physical bullion, gold-backed trade, or expert market advisory, Gold Trade is your premier partner in the Middle East.
Disclaimer: This report is for informational purposes only and does not constitute financial advice. Gold trading involves significant risk. Investors should conduct their own research or consult with a professional advisor at Gold Trade, Dubai, before making any investment decisions.
« Back to News & Reports List