January 08, 2026
Gold Technical Analysis Report – 08 Jan 2026: XAU/USD Consolidation Near All-Time Highs as Dubai Market Eyes $4,600
The first week of 2026 has been nothing short of historic for the global bullion markets. Following a record-breaking performance in 2025, where the yellow metal redefined its role as the world's premier reserve asset, the market is entering a crucial phase of technical consolidation. At Gold Trade, our latest analysis for today, January 08, 2026, reveals a market that is catching its breath after a relentless surge, yet maintaining a structural bullish bias that continues to attract institutional and retail investors alike.
This Gold Technical Analysis Report - 08 Jan 2026 breaks down the critical price levels, momentum indicators, and fundamental shifts influencing the XAU/USD pair, with a specialized focus on the Dubai gold market dynamics.
Market Overview: The January "Pullback" or Profit-Taking?
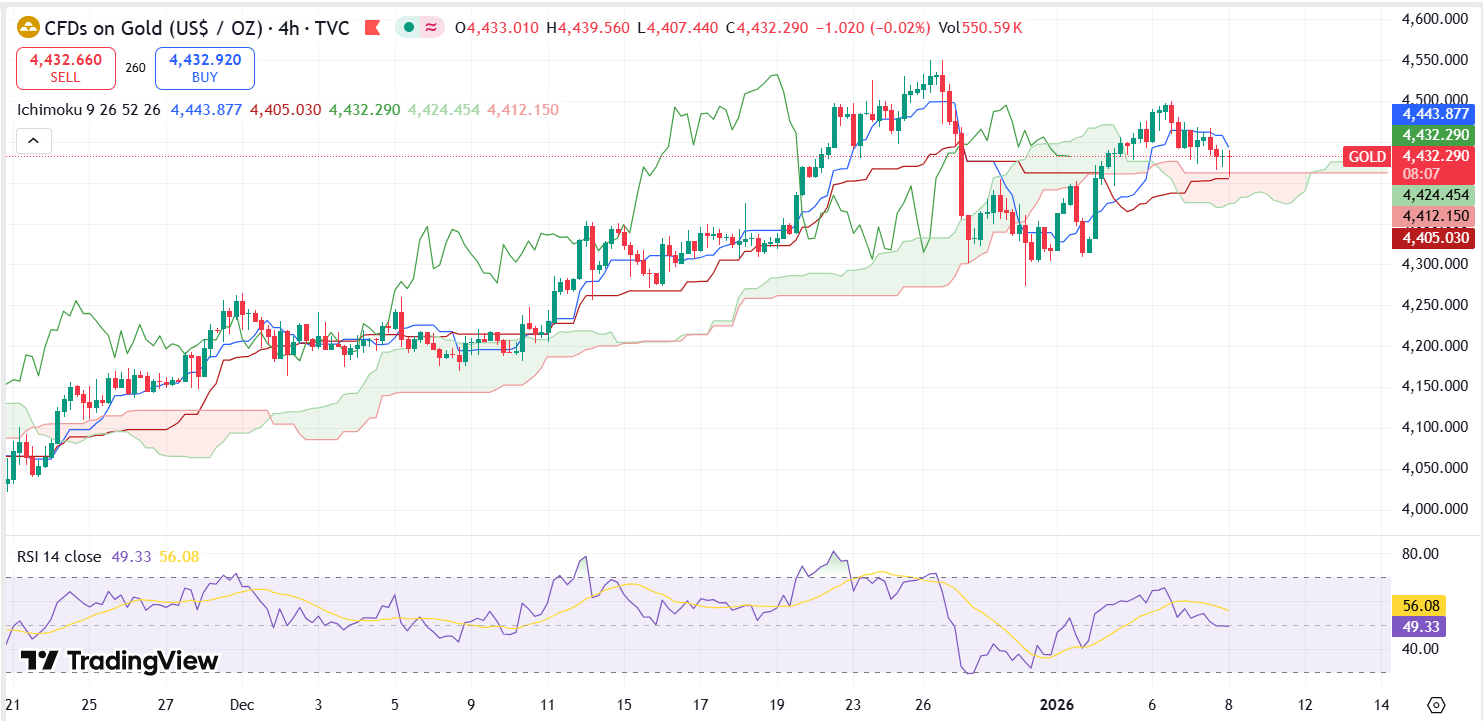
As of mid-day trading on January 8, 2026, Spot Gold (XAU/USD) is oscillating around the $4,415 - $4,430 range. This follows a minor retreat from the recent all-time high of $4,550 reached during the final trading sessions of December 2025.
In the local UAE market, Dubai 24K gold is currently priced at AED 533.75 per gram. While this is a slight dip from earlier in the week, it remains significantly elevated compared to the sub-AED 500 levels seen mid-way through last year. The "City of Gold" continues to witness strong demand as investors utilize this minor correction to rebalance their portfolios.
Technical Indicators: Decoding the Momentum
The technical structure for gold remains robustly bullish on the weekly and monthly timeframes, though the daily charts suggest a period of healthy "cooling off."
1. Key Support and Resistance Levels
For traders looking to enter or exit positions today, the following levels are critical:
| Level Type | Price (USD/oz) | Context / Significance |
|---|---|---|
| Primary Resistance | $4,500 | Psychological barrier; a daily close above this confirms a run to $4,600. |
| Immediate Support | $4,410 | This week's intraday floor; must hold to prevent a deeper correction. |
| Secondary Support | $4,380 | The former October 2025 high; now acting as a critical structural base. |
| Major "Floor" | $4,285 | Aligns with the 50-day Simple Moving Average (SMA). |
2. Moving Averages and Trend Lines
The 50-day and 200-day SMAs are currently trending upwards in a parallel formation, a signal of a mature and stable uptrend. The current price action is hovering just above the 20-day Exponential Moving Average (EMA) , which serves as a dynamic support level for short-term trend-followers.
3. RSI and MACD Analysis
- Relative Strength Index (RSI): The 14-day RSI has eased from "overbought" territory (above 70) and is currently sitting at 58. This is a positive sign for bulls, as it removes the risk of a "blow-off top" and creates room for the next leg of the rally without immediate exhaustion.
- MACD (Moving Average Convergence Divergence): The MACD histogram has shown a minor bearish crossover on the 4-hour chart, reflecting the current profit-taking phase. However, the signal lines remain well above the zero-center line on the daily chart, confirming that the medium-term momentum has not shifted.
Fundamental Catalysts: Why Gold is Holding its Ground
Beyond the charts, several unprecedented geopolitical and economic events are providing a fundamental floor for gold prices in early 2026.
The Fed’s Dovish Path
The U.S. Federal Reserve is widely expected to continue its rate-cutting cycle throughout 2026. Current market pricing suggests at least three more 25-basis point cuts by mid-year. As real yields remain capped, the opportunity cost of holding gold—which has reached a "strategic asset" status—remains historically low.
Geopolitical "Structural Risk"
January 2026 has seen a resurgence in geopolitical volatility. Tensions regarding trade fragmentation in Asia and political shifts in South America (notably the ongoing energy crisis in Venezuela) have kept the safe-haven bid alive.
Analyst Insight: Unlike previous cycles where gold spiked only on "fear," the 2026 market sees gold being used as a structural hedge against policy credibility. Investors are no longer just buying gold to avoid a crash; they are buying it to diversify away from a highly leveraged global debt system.
The Dubai Advantage: Local Retail Trends
For clients of Gold Trade, the local market offers a unique perspective. Dubai's retail prices have shown remarkable resilience during this global pullback.
24K and 22K Prices in Dubai
- 24K Gold: AED 533.75 (approx. $145.30 per gram)
- 22K Gold: AED 494.25
- 18K Gold: AED 404.50
Dubai remains the most competitive hub for gold acquisition due to its transparent pricing and zero-VAT policies on investment-grade bullion. Many institutional funds are currently using Dubai as a clearing house for physical gold to hedge against potential currency volatility in the Eurozone and Asian markets.
Trading Strategy: Positioning for the Q1 2026 Rally
Based on the current technical setup, Gold Trade recommends the following strategic approaches for the month of January:
For Short-Term Traders (Day/Swing)
The $4,410 level offers an attractive "buy-the-dip" entry point. Look for a reversal candle on the 1-hour chart near this support. Targets should be placed at $4,475 and $4,520. A stop-loss below $4,380 is recommended to manage risk against a deeper-than-expected correction.
For Long-Term Investors (Portfolio Hedgers)
Any price between $4,400 and $4,430 is considered a value-entry zone for long-term holders. With major financial institutions like Morgan Stanley forecasting gold to reach $4,800 by Q4 2026, the current consolidation phase provides a window of opportunity before the next major breakout above the psychological $4,500 barrier.
Conclusion: A Constructive Outlook for 2026
The Gold Technical Analysis Report - 08 Jan 2026 paints a picture of a market in transition. While the "easy money" from the late 2025 surge has been made, the underlying forces—central bank demand, a dovish Fed, and structural geopolitical risks—remain firmly in place.
Gold has evolved from a defensive play into a core performance asset. For traders in Dubai, the focus remains on the $4,500 resistance. Once breached, $4,600 and $4,750 become the next logical targets in this historic bull cycle.
Financial Disclaimer: This technical analysis report for 08 January 2026 is provided by Gold Trade, Dubai for informational purposes only. It does not constitute financial, investment, or legal advice. Precious metals trading involves significant risk of loss. Always conduct your own due diligence or consult with a licensed professional before making trading decisions.
« Back to News & Reports List