January 09, 2026
Silver Technical Analysis Report – 09 Jan 2026: XAG/USD Battles $78.00 Resistance as Industrial Super-Cycle Ignites
The "White Metal" has entered 2026 with a velocity that has caught many institutional desks by surprise. As global markets pivot toward the first major economic data release of the year—the US Nonfarm Payrolls (NFP)— Silver (XAG/USD) is currently hovering at a critical psychological and technical juncture: $78.00 per ounce.
At Gold Trade, we have witnessed a 40% increase in physical silver volume over the last quarter, signaling a massive shift in retail and sovereign wealth sentiment. This report provides a comprehensive Silver Technical Analysis Report - 09 Jan 2026, examining why the $78.00 level is the "line in the sand" for the next bull run toward the triple-digit territory.
The 2026 Macro Landscape: Silver’s Dual Identity
Unlike gold, which serves primarily as a monetary hedge, silver’s performance in early 2026 is being driven by its dual identity as both a safe-haven asset and an indispensable industrial commodity.
1. The Green Energy Deficit
By January 2026, the global shift toward renewable energy has moved from policy to massive physical infrastructure. Silver is the primary component in high-efficiency photovoltaic (solar) cells and the burgeoning Solid-State Battery (SSB) market for long-range electric vehicles. With global silver mine production stagnating due to rising ESG (Environmental, Social, and Governance) compliance costs, the physical deficit is estimated to reach 240 million ounces this year.
2. The Dubai Bullion Hub
In Dubai, the local market has become the epicenter for physical silver delivery. As of today, the Silver Price in Dubai stands at AED 314.15 per ounce (AED 10.10 per gram) . The absence of VAT on investment-grade bullion in the UAE continues to draw significant capital from the Indian subcontinent and Europe, providing a "liquidity floor" that prevents deep price corrections.
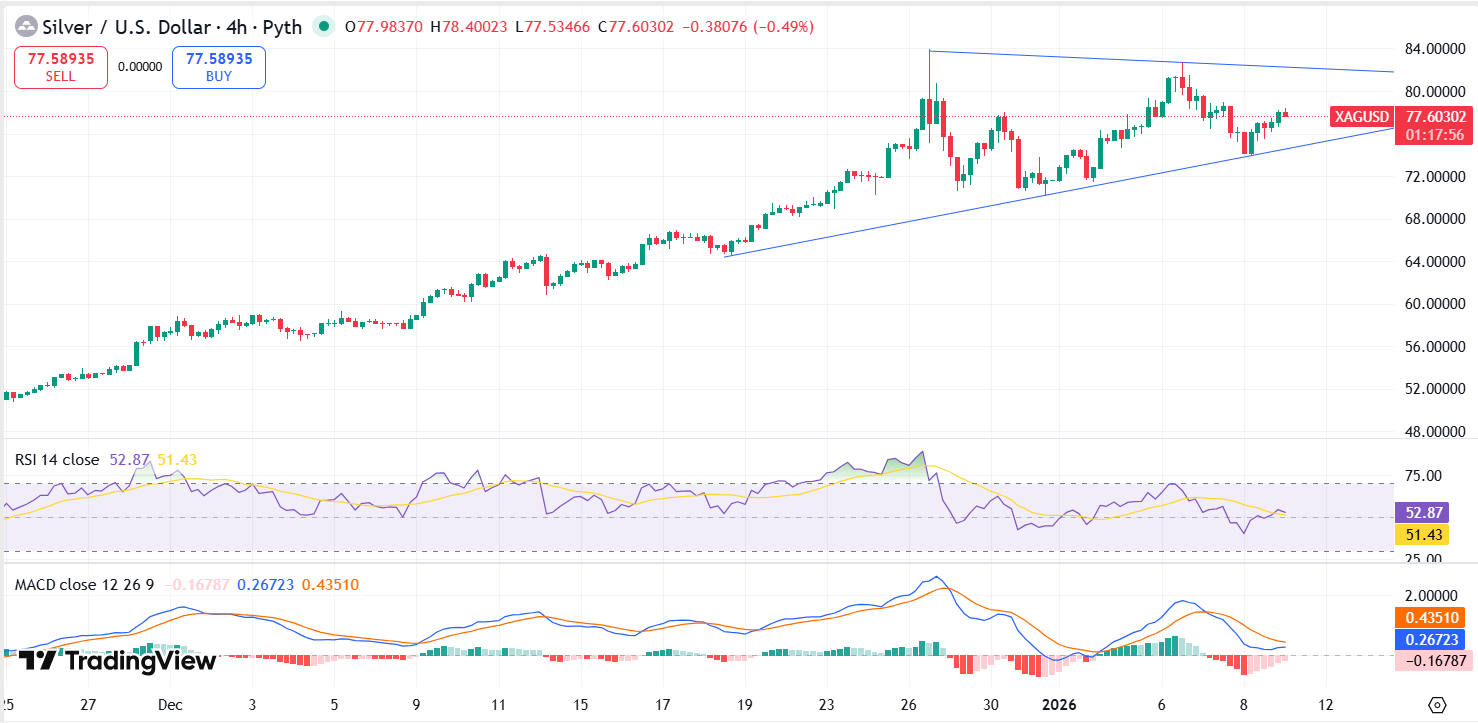
Technical Analysis: XAG/USD Price Action and Chart Patterns
The $78.00 Pivot Point
Silver is currently trading in a tight range centered at $78.00. Technically, this level represents the 61.8% Fibonacci retracement level of the historic 2025 surge.
- Bullish Breakout: A daily close above $78.50, supported by high volume, would confirm a "Cup and Handle" pattern on the weekly chart. This formation suggests a measured move target of $94.00 by the end of Q1 2026.
- Bearish Rejection: If the $78.00 level acts as a "hard ceiling" during today’s US session, we expect a healthy retracement to the $74.50 support zone, which aligns with the 50-day Simple Moving Average (SMA).
Moving Averages: The Golden Cross Evolution
The "Golden Cross" (where the 50-day SMA crosses above the 200-day SMA) occurred in late 2025, and the gap between these two indicators is widening. The 200-day SMA is currently trending at $62.10, while the 50-day SMA is at $73.80. This widening "alligator mouth" confirms that the long-term trend is strongly bullish, even if short-term volatility persists.
Momentum Indicators: RSI & MACD
- Relative Strength Index (RSI): The RSI is currently reading 64.12. This is a bullish neutral zone. It indicates that while silver is performing strongly, it is not yet "overbought" (above 70). This suggests there is still "fuel in the tank" for a push toward $80.00 today.
- MACD (Moving Average Convergence Divergence): The MACD histogram has just flipped positive on the 4-hour chart. The signal line is trending upward, indicating that the buying momentum is accelerating heading into the NFP release.
Key Support and Resistance Levels (Jan 09, 2026)
For traders and investors at Gold Trade, Dubai, the following levels are critical for setting stop-loss and take-profit orders:
| Level Type | Price (USD) | Price (AED) | Significance |
|---|---|---|---|
| Resistance 3 | $85.50 | AED 313.80 | Multi-year High / Sell Zone |
| Resistance 2 | $81.20 | AED 298.00 | Major Psychological Ceiling |
| Resistance 1 | $79.40 | AED 291.40 | Immediate Breakout Trigger |
| Current Price | $78.00 | AED 286.50 | Market Pivot Point |
| Support 1 | $76.20 | AED 279.65 | Intra-day Buying Zone |
| Support 2 | $74.50 | AED 273.40 | 50-Day SMA / Strong Floor |
| Support 3 | $71.00 | AED 260.50 | Long-term Accumulation Zone |
Today’s Catalyst: The US NFP and the Dollar Index (DXY)
The primary driver for today’s price action will be the US Nonfarm Payrolls (NFP) report. In the 2026 economic environment, the Federal Reserve is balancing a "soft landing" with persistent energy-driven inflation.
- Weak NFP (<150k jobs) : This would likely cause the US Dollar to weaken. Silver, being denominated in USD, would see an immediate spike. Under this scenario, we expect silver to blast through $78.00 and test $80.00 before the New York close.
- Strong NFP (>220k jobs): A strong labor market might lead the Fed to keep interest rates "higher for longer." This would bolster the Dollar and potentially push silver down to test the $75.00 support level.
The Gold/Silver Ratio: A Strategic Insight
The Gold/Silver Ratio is currently sitting at 57:1. Historically, when silver enters an industrial super-cycle, this ratio tends to compress toward 40:1.
At Gold Trade, we are advising our clients that silver currently offers a higher percentage-gain potential than gold in the short-to-medium term. While gold remains the ultimate wealth preservation tool, silver at $78.00 is acting as the "high-beta" play for those looking to capitalize on the 2026 infrastructure boom.
Investor Sentiment in Dubai
The Dubai Gold Souk and the DMCC (Dubai Multi Commodities Centre) are reporting record-breaking inflows into silver ETPs (Exchange Traded Products) and physical vaulted silver.
"We are seeing a demographic shift," says a Senior Analyst at Gold Trade. "Younger investors in the UAE are moving away from crypto-volatility and toward 'Digital Silver' and physical bars. They see $78.00 not as a peak, but as a stepping stone to the triple digits."
Conclusion: Strategic Outlook for January 2026
The technical setup for silver on this 09 Jan 2026 is one of calculated optimism. The metal has successfully turned former resistance levels into support. As long as the price maintains its footing above the $74.50 zone, the path of least resistance is upward.
The confluence of a physical supply deficit, a weakening US Dollar, and a massive industrial appetite makes silver the asset to watch this quarter. Whether you are a day trader looking to scalp the NFP volatility or a long-term investor looking to hedge your portfolio, the $78.00 mark is a historic entry point.
How to Trade Today’s Market?
- For Bullish Traders: Look for a break above $78.50 on the 15-minute chart following the NFP announcement. Target $80.50 with a stop-loss at $77.20.
- For Value Investors: Any dip toward the $75.00 range should be viewed as a high-probability accumulation zone for a long-term hold toward $100.00.
Disclaimer: This report is for informational purposes only and does not constitute financial advice. Trading in precious metals involves risk. Always consult with a professional financial advisor before making investment decisions.
« Back to News & Reports List