January 09, 2026
Gold Technical Analysis Report – 09 Jan 2026: XAU/USD Eyes $4,500 Amid Venezuela Crisis and US NFP Volatility
The global bullion market continues its historic ascent as we enter the second trading week of 2026. For investors at Gold Trade, the landscape has never been more dynamic. As of this morning, Friday, January 09, spot gold (XAU/USD) is navigating a high-stakes consolidation phase, trading near $4,471 per ounce, while the local Dubai 24K gold price holds firm at AED 533.75 per gram.
This report provides an in-depth Gold Technical Analysis Report - 09 Jan 2026, breaking down the critical price barriers, the impact of the "Venezuela Shock," and the anticipated volatility surrounding today's US Nonfarm Payrolls (NFP) release.
Market Sentiment: The "Fear and Fundamentals" Convergence
Gold enters today’s session underpinned by a potent mix of geopolitical instability and shifting monetary expectations. The primary catalyst remains the escalating crisis in Venezuela, following recent territorial disputes and leadership fractures that have threatened global oil and "shadow gold" supplies. For a global hub like Dubai, these supply-side shocks translate directly into higher premiums and sustained safe-haven demand.
Furthermore, the market is bracing for the US December Jobs Report (NFP) , scheduled for release later today. Analysts at Gold Trade suggest that any sign of labor market cooling could provide the necessary fuel for gold to shatter the psychological $4,500 resistance level.
Technical Analysis: Breaking Down the XAU/USD Chart
From a technical perspective, gold’s long-term trajectory remains undeniably bullish. However, the short-term indicators suggest a "coiling" effect, where price action is tightening before a major breakout.
1. Daily Chart Structure
On the daily timeframe, gold continues to respect a series of higher highs and higher lows. The metal is currently trading within a descending trend line originating from the December 29 record high of $4,549.71.
- The Bullish Case: A daily close above the $4,490 mark would negate the recent minor correction and open the doors for a retest of the all-time high.
- The Bearish Case: Failure to hold the $4,450 pivot point could see a retracement toward the 21-day Simple Moving Average (SMA), currently situated at $4,387.
2. Moving Averages and the "Golden Cross"
The moving average alignment remains the strongest evidence for the structural bull market. The 50-day SMA ($4,231) and the 200-day SMA ($3,666) are both sloping aggressively upward. On the 4-hour chart, we observed a "Golden Cross" earlier this week, signaling that short-term momentum is fully aligned with the multi-year uptrend.
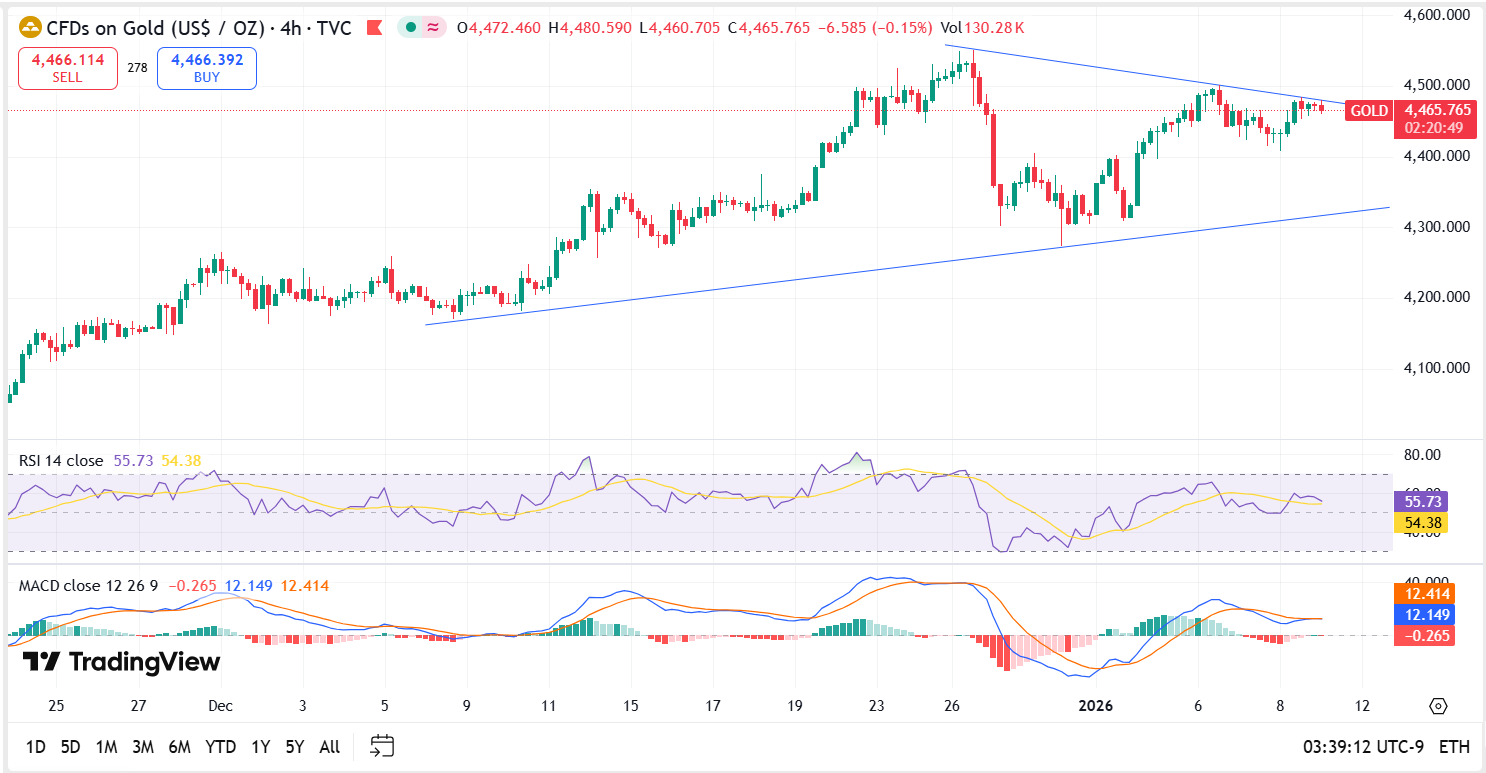
3. Momentum Indicators (RSI & MACD)
The Relative Strength Index (RSI) currently sits at 62.39. This is a "sweet spot" for bulls; it indicates strong buying interest without yet reaching the extreme "overbought" territory (above 70) that often precedes a sharp sell-off. The MACD (Moving Average Convergence Divergence) histogram is showing diminishing bearish bars, suggesting that the selling pressure seen on January 7-8 has exhausted itself.
Key Technical Levels to Watch
Investors should monitor the following support and resistance zones for the Jan 09 session:
| Level Type | Price (USD/oz) | Significance |
|---|---|---|
| Resistance 3 | $4,550 | Record High / Ultimate Target |
| Resistance 2 | $4,500 | Major Psychological Barrier |
| Resistance 1 | $4,490 | Trend Line Breakout Point |
| Current Price | $4,471 | Pivot Zone |
| Support 1 | $4,450 | Immediate Floor / 20-period MA |
| Support 2 | $4,407 | Thursday’s Low / Psychological Support |
| Support 3 | $4,387 | 21-day SMA / Strong Buying Zone |
The Dubai Factor: Local Gold Market Trends
In Dubai, the "City of Gold," retail and institutional demand remains at record levels. The local market has become a preferred destination for investors looking to hedge against the volatility in Western equity markets.
- 24K Gold Price: AED 533.75 per gram.
- 22K Gold Price: AED 494.25 per gram.
We are seeing a notable shift in investor behavior at Gold Trade. There is an increasing preference for physical bullion bars (1kg and 10-tola) as a long-term store of value, particularly as the Gold/Silver Ratio begins to compress, suggesting that precious metals are entering a "super-cycle" phase.
Strategic Outlook for Jan 09, 2026
The NFP Wildcard
Today’s NFP data is expected to show an addition of approximately 185,000 jobs.
- Worse-than-expected (Below 160k): This would likely weaken the US Dollar (DXY) and propel Gold toward $4,510 within hours.
- Better-than-expected (Above 210k): A strong labor market could empower the Fed to maintain higher rates for longer, potentially causing a temporary dip in gold toward the $4,420 support zone.
Trading Strategy Recommendation
For the Intraday Trader: Look for "Buy on Dip" opportunities if the price touches the $4,450 – $4,460 range, with a tight stop-loss below $4,435. Target the $4,500 psychological resistance.
For the Long-term Investor: The current levels, while high, still represent a strategic entry point before the anticipated push toward $5,000 by Q4 2026. We recommend a "Dollar Cost Averaging" (DCA) approach to mitigate short-term volatility.
Conclusion: Gold Technical Analysis Report - 09 Jan 2026
The technical consensus for gold on this Friday is cautiously bullish. While the market is "directionless" in the early European session, the underlying structural supports—central bank demand, geopolitical shocks in South America, and a technical "Golden Cross"—suggest that the path of least resistance remains to the upside.
At Gold Trade, we remain committed to providing the most accurate and unique market intelligence to help you navigate these historic times. Gold is not merely a commodity in 2026; it is the ultimate insurance policy against a fragmenting global order.
Disclaimer: The information provided in this Gold Technical Analysis Report is for educational purposes only and does not constitute financial advice. Trading gold and precious metals involves significant risk. Investors should conduct their own research or consult with a professional financial advisor before making any investment decisions.
« Back to News & Reports List